

By Ryan Wallis, news correspondent
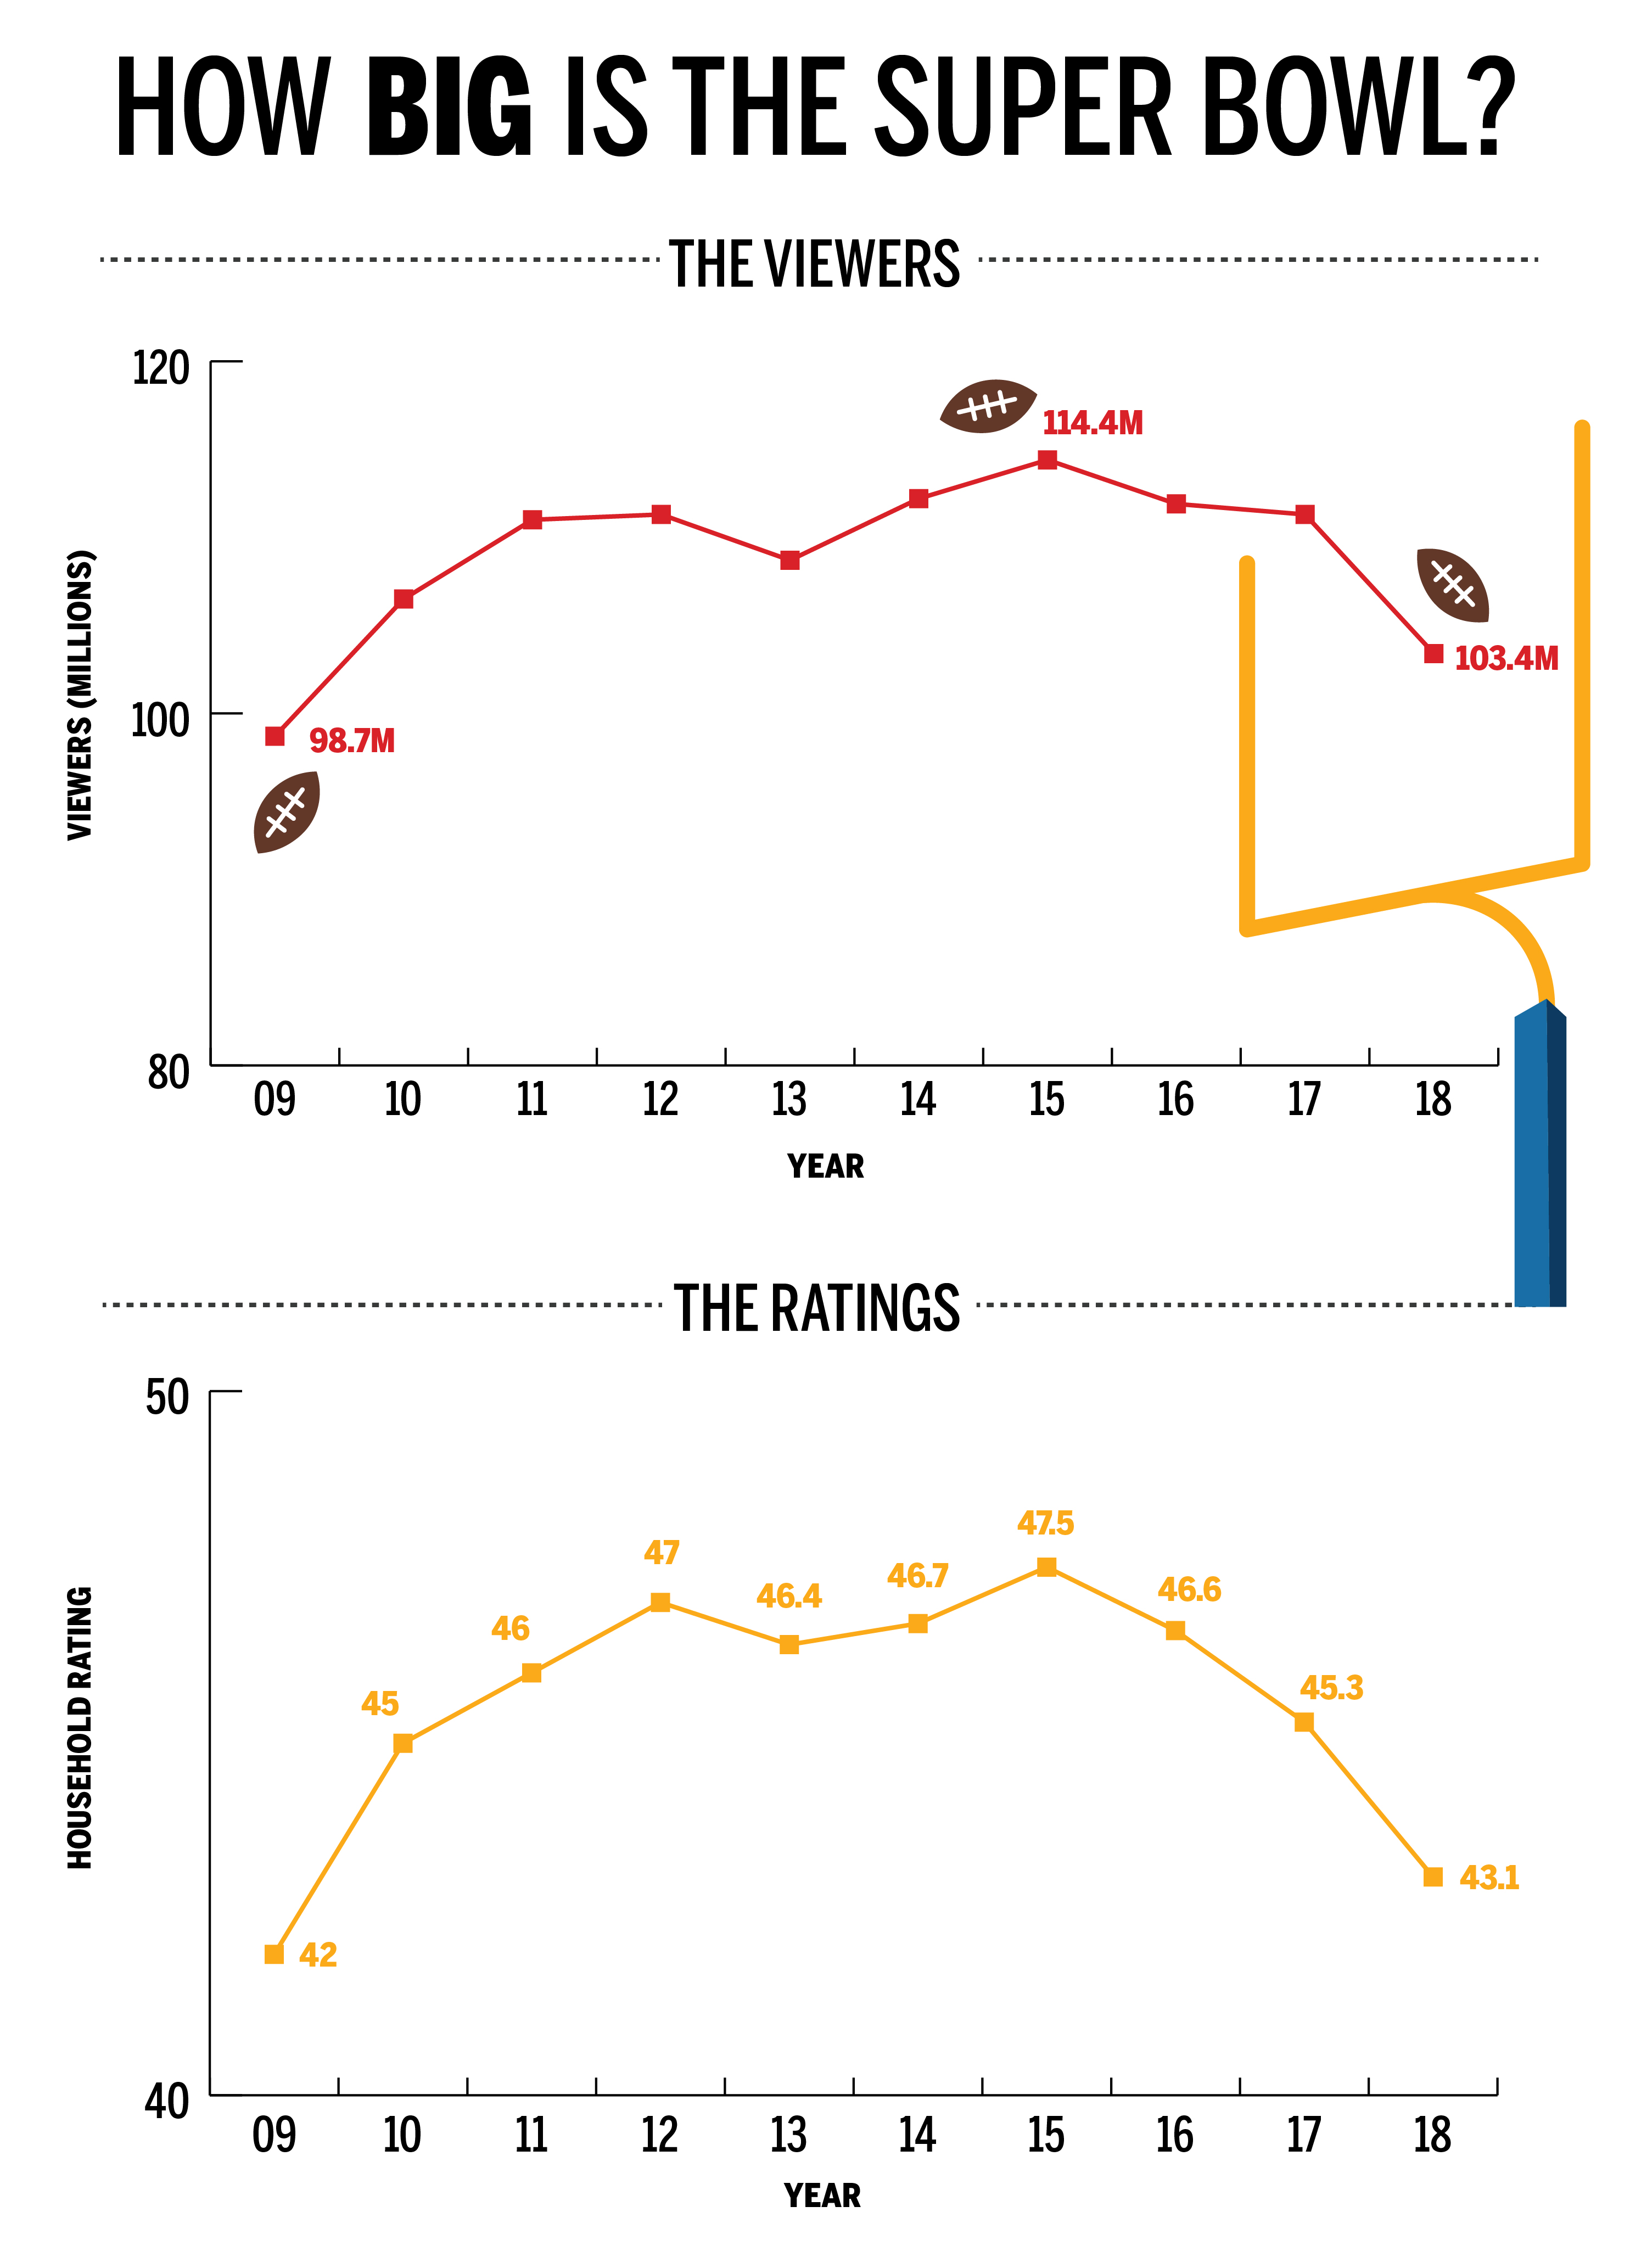
The NFL ratings slump that plagued the regular season persisted in Sunday’s Patriots 2018 Super Bowl loss. Despite the game being one of the most exciting in history, according to Slate’s Justin Peters, viewership averaged only 103.4 million people nationally. That is down 7.6 percent from last year’s 111.3 million and marks the lowest-viewed Super Bowl since 2009. On the bright side, it will still easily be the most-watched telecast of the year, and currently ranks as the 10th most-watched telecast in U.S. history.
The New England Patriots’ 2015 Super Bowl win over the Seattle Seahawks still remains the highest viewed telecast in U.S. history with 114.4 million viewers. In 2017, the Super Bowl fell to 111.9 million viewers and the 2017 Super Bowl dropped further. This year’s 7.9 million viewer drop marks the first time in Super Bowl history that there have been three consecutive years of viewership decline.
The NFL’s critics are quick to point to the increased politicization of the league this year, with both conservative and liberal pundits spouting off different reasons to boycott. However, to look at why Super Bowl viewership is down, it is important to look at why the same was true for the regular season, considering regular season ratings have typically been a good indicator of Super Bowl ratings. This season was no exception, and dropping 10.7 percent year-to-year in the regular season paved the way for another Super Bowl drop.
The game had everything it needed to break a ratings record: everything, that is, except 11 million additional viewers at the start. The game only averaged 89.4 million viewers in its initial half hour, down from the 96 to 101 million viewers that the past three Super Bowls have averaged in their first half hours. This biggest positive out of this Super Bowl was consistent viewership growth over its half-hours, without which the game would’ve averaged an even smaller audience .
None of the past three Super Bowls saw such consistent viewership growth, each losing at least 1.5 million viewers at some point during the game. Both Super Bowls XLIX and LI, regained the lost viewership in subsequent half-hours, but in Super Bowl 50, viewership steadily declined after half-time. Super Bowl LII saw about an average of 3 percent viewership growth, higher than both Super Bowls 50 (1.6 percent) and LI (2.2 percent).
Had Super Bowl LII grown in the same manner as Super Bowl 50, it would’ve had an average of 102.3 million viewers, and had it grown at the same rate as Super LI, it would’ve averaged 102.9 million viewers. However, if Super Bowl LII held its 3 percent growth rate, yet began with the initial 101 million viewers of Super Bowl 50, the game could’ve averaged a record-breaking 117.3 million viewers.
Why are ratings decreasing?
The declines seem to be much less about waning interest in the NFL and much more about waning interest in traditional television. Television ratings as a whole are down year-to-year, so it’s difficult to reasonably conclude links to other potential influences, including politics.
NFL ratings have a been hot discussion point over the season as the sport intermixed with the political sphere, in which pundits claim a causational relationship between NFL player protests and the decline of NFL viewership. NFL regular season games on CBS and FOX were seen by an average of 12.3 percent of U.S. households this past season, down about 9 percent from last year.
The lack of high-interest matchups perhaps contributed to the low NFL ratings this year. Games that average between 12.3 percent and 15 percent of households were “above average” in the rating scale this season, and games that managed above 15 percent were considered to be high-rated. There was a severe lack of above-average and high-rated games this season.
The highest-rated NFL game of the regular season was the week 15, Patriots-Steelers matchup, which was viewed by 15.2 percent of households, including 39.2 percent in the Boston area. That game was the only regular season game this year to average more than 15 percent of U.S. households; in addition, only nine games scored between a 12.3 and 15.
Last year, by comparison, there were three high-rated games — including one game that actually saw above 16 percent — and 19 above-average games. In terms of total viewers, the 2017 regular season averaged 14.9 million viewers per game, down 10.7 percent from the 2016 season.
This past season did see an increase in viewership on streaming platforms. According to FOX Sports, nearly 470,000 people streamed the NFC Championship game on FOX Platforms, up from last year’s near-330,000.
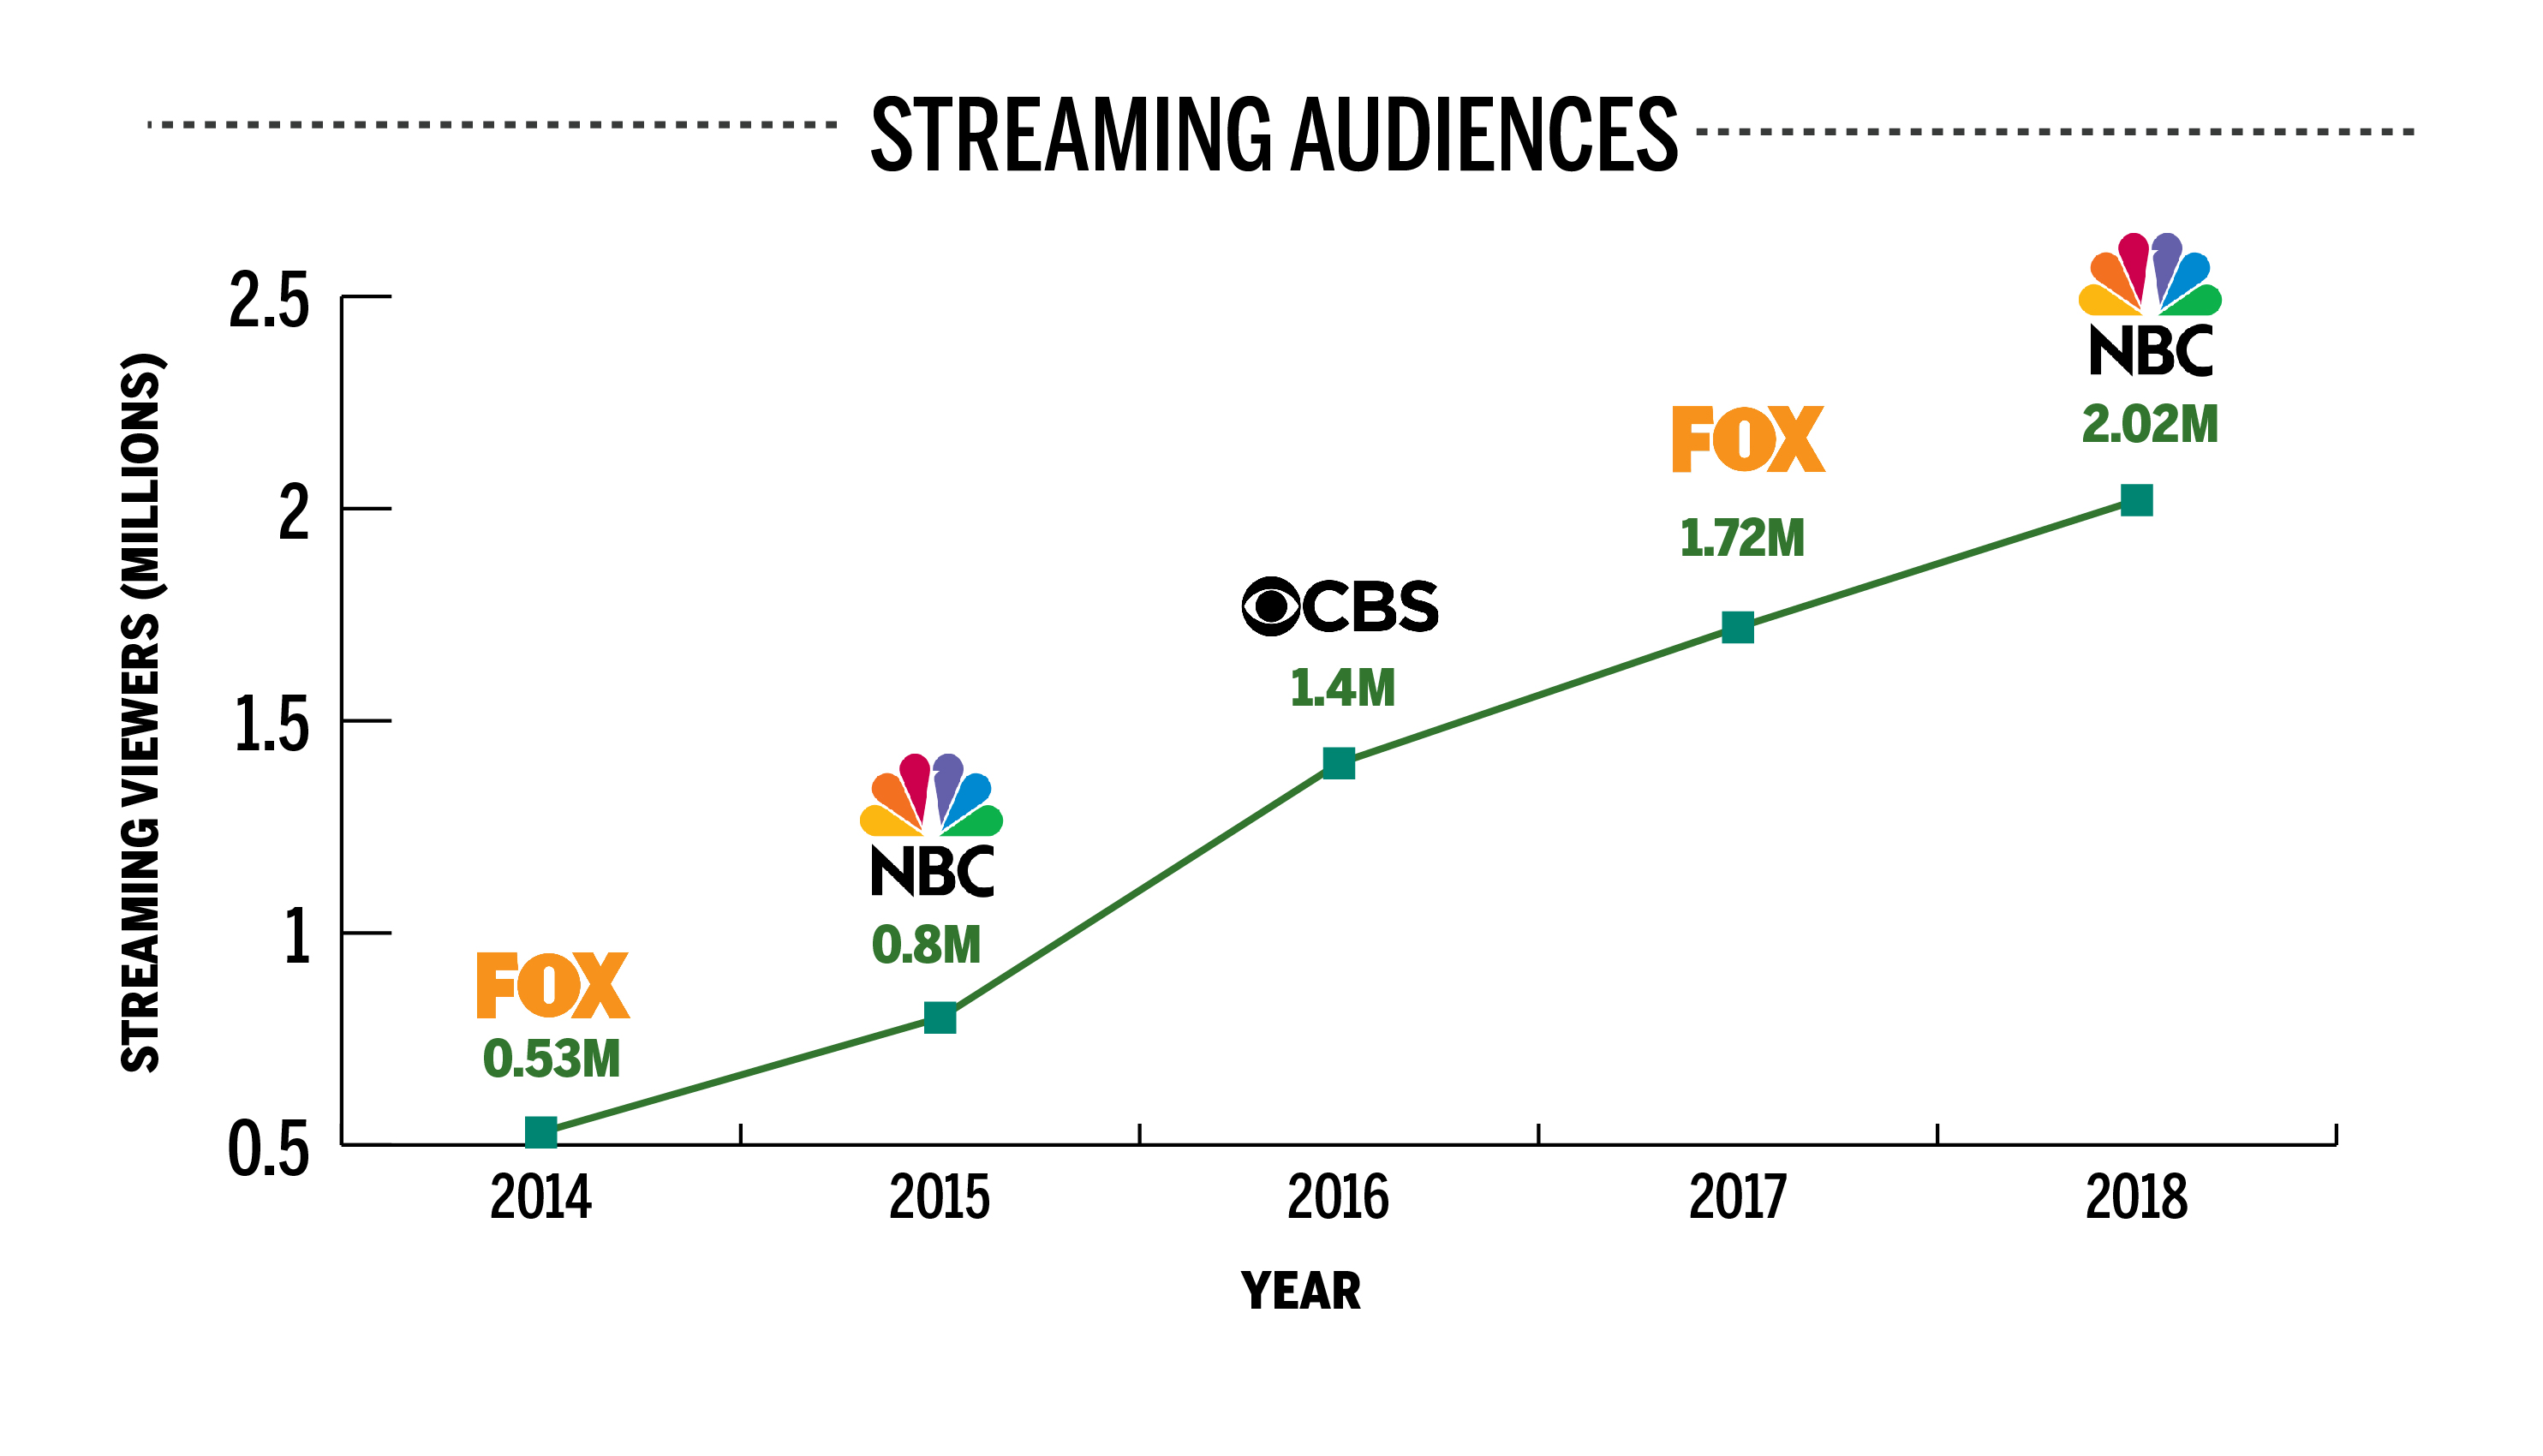
Looking at the Super Bowl, streaming audiences have also been increasing. The game averaged around 800,000 on NBC platforms in 2015 and a record-breaking 2.02 million on NBC platforms this year.
However, that is only about 300,000 more streaming viewers than last year, which doesn’t account for the 7.9 million year-to-year TV viewer decline. The NFL must look elsewhere to account for those lost viewers.
The percentage of people watching TV has also decreased from last year. On the first 15 Sundays of the 2017 television season, 28.3 percent of people aged 18 to 49 were watching TV in primetime — down four points from last season.
A decline in regular season NFL viewership will not always spell out a decline in viewership for the Super Bowl, as Super Bowls have potential to bring back audiences lost in the regular season.
In a recent example, the 2011 season Super Bowl was actually up 0.3 percent in viewership from the 2010 season Super Bowl despite the regular season being down 2.2 percent in viewership. The significance of the Super Bowl, however, has its limits. Considering that the regular season this year was down about 10 percent, the Super Bowl was able to make up little ground: down 8 percent year-to-year.
In terms of social media interactions, this year’s Super Bowl averaged 170.7 million total interactions across Facebook, Twitter and Instagram in the United States. Despite the inclusion of Instagram in social ratings for the first time this year, the Super Bowl was still down more than 20 million interactions from last year’s game, when only Facebook and Twitter were counted.
Market ratings for the 2018 Super Bowl
The top local market for Sunday’s Super Bowl was Buffalo, New York, which had a 56.4 rating and 78 share. Philadelphia took the second spot with a 56.2 rating, and Boston took third with a 55.9 rating. Other top local markets were Minneapolis; Pittsburgh; Norfolk, Virginia; New Orleans; Providence, Rhode Island; Milwaukee; Seattle; and Kansas City, Missouri.
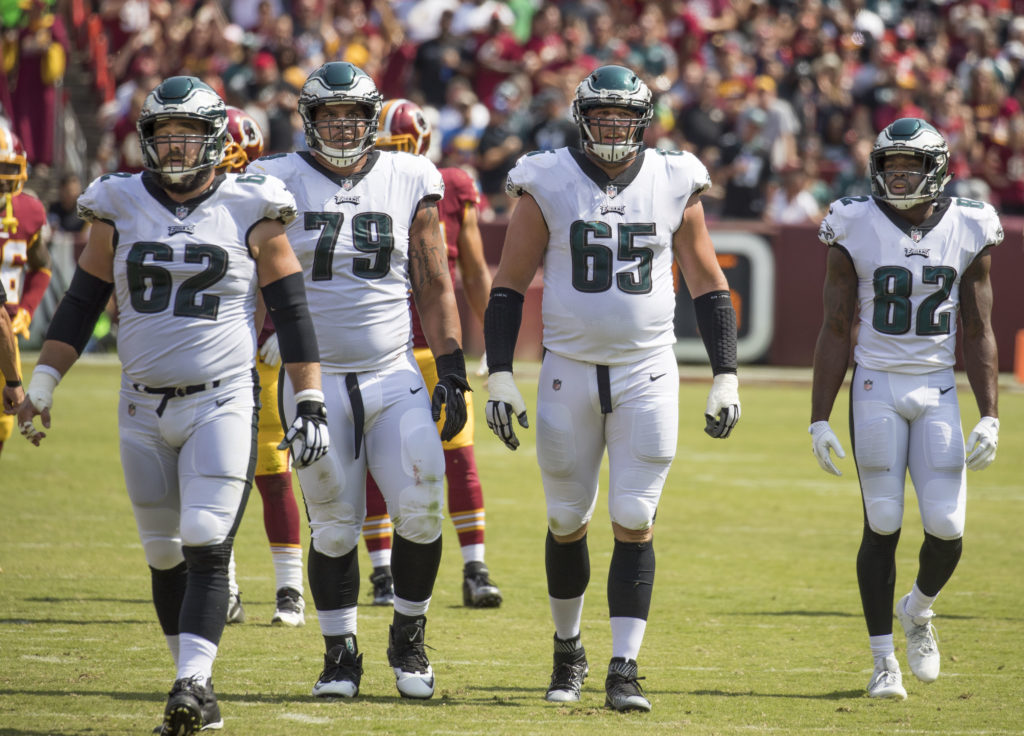
Both Boston and Philadelphia saw rises from last year’s local ratings, in which Boston notched a 54.3 and Philly had a 48.9. The Eagles’ presence in the Super Bowl made Philadelphia’s rating jump this year, in the same vein that Atlanta’s year-to-year Super Bowl rating dropped from 57.0 last year to 47.1 this year.
Other year-to-year rises include host city Minneapolis, Miami and New Orleans. The other seven top markets this year saw year-to-year declines.
The Patriots’ first Super Bowl win of the Belichick era back in 2002 had a 56.1 rating in Boston. That figure dropped to 52.2 in 2004, but steadily rose in the years following, up to 53.1 for their 2005 win over the Eagles and eventually to a record 61.0 for their 2015 win over the Seattle Seahawks.
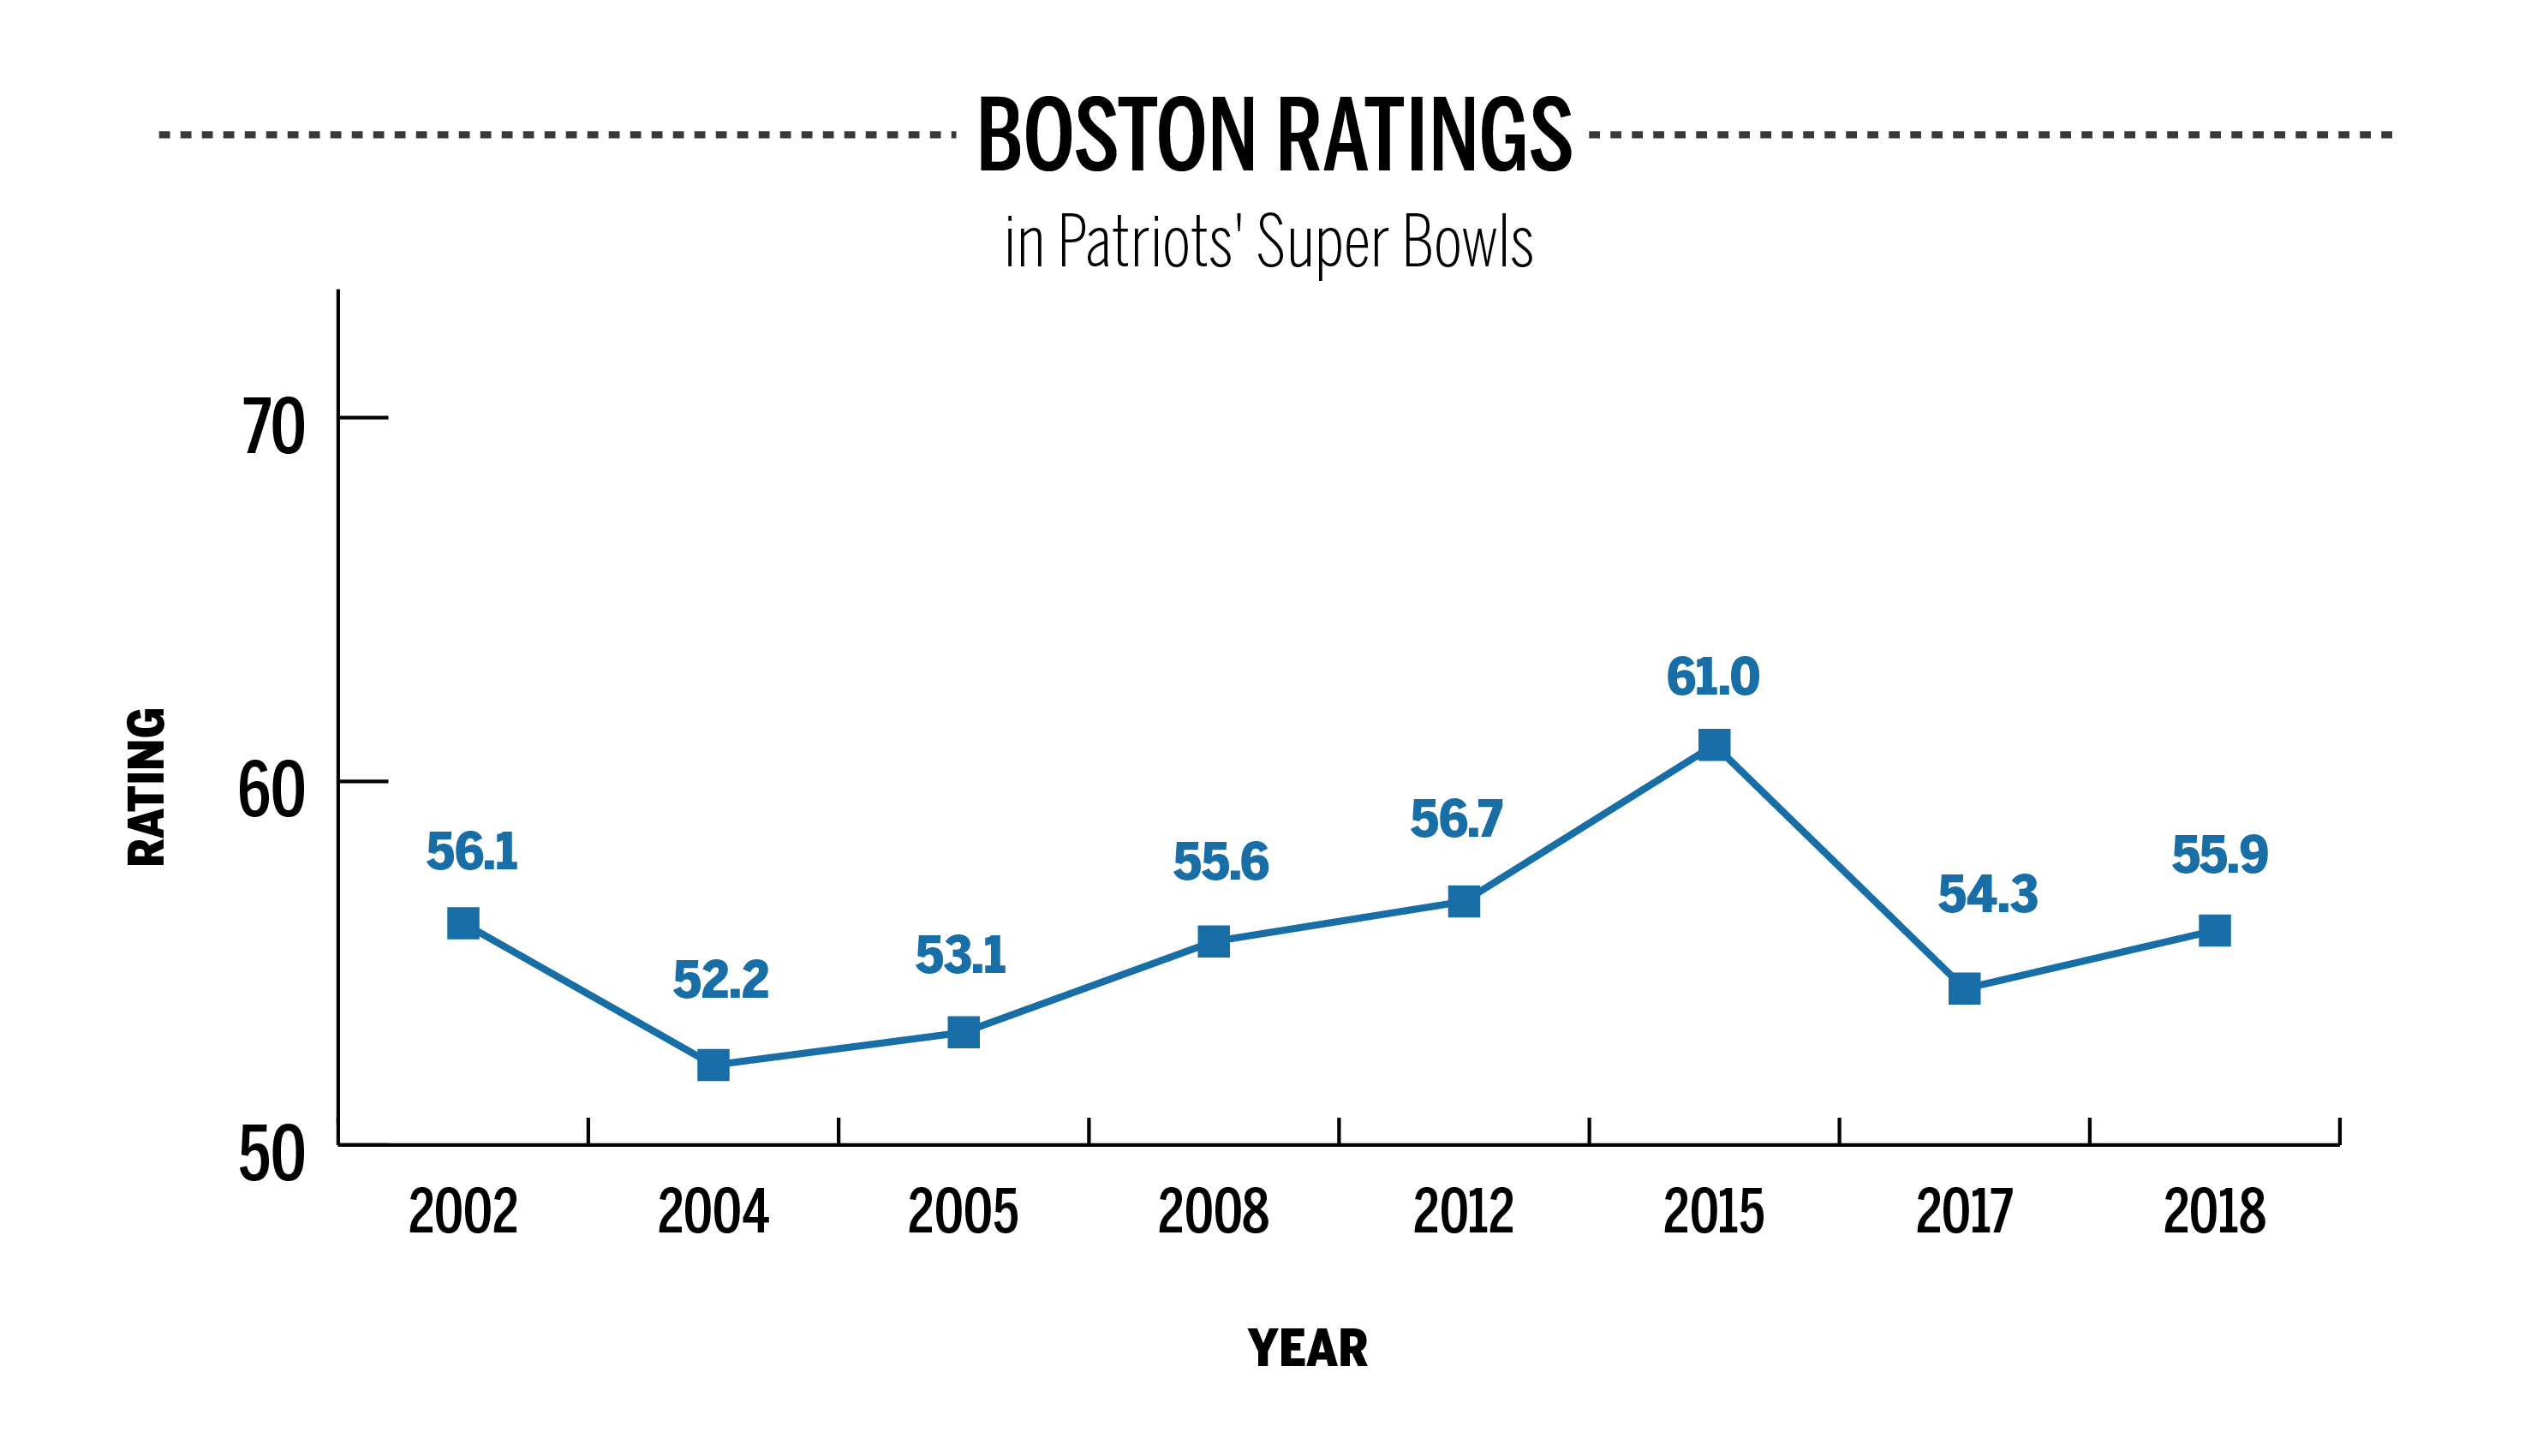
Last year, however, only 54.3 percent of Boston area households tuned in to watch their comeback win over the Atlanta Falcons. This year’s 55.9 rating is a far cry from the 2015 Super Bowl’s 61.0 rating, but it still ranks as the fourth highest-rated Super Bowl in Boston history.
Boston has also consistently ranked high when it comes to college-aged individuals, defined as people aged 18-24, watching the Super Bowl. Last year’s game was viewed by 37.5 percent of Boston-area college-aged students — the highest percentage among all top-25 markets in the country.
The AFC Championship game this year was seen by 50.1 percent of Boston-area households, down 3 percent from last year’s game. This year’s NFC Championship was seen by 50.3 percent of Philadelphia-area households. Both cities saw a rise of almost 6 points between the Championship games and the Super Bowl.
January sports ratings highlights
Outside of the NFL, the College Football Championship, airing Jan. 8 on ESPN, had 27.38 million viewers nationally, including 327,000 viewers in the Boston area (5.5 rating). Atlanta, by comparison, had 2.14 million viewers watching the game – a 33.3 rating.
NBC Sports Network coverage of the Bruins/Canadiens NHL game on Jan. 18 was seen by 454,000 viewers across the country, including 147,000 from the Boston area, a little less than a third of the audience.
The top primetime telecast in Boston in the month of January was the AFC Divisional round against the Tennessee Titans which was viewed by 43.5 percent of Boston area households and had 1.92 million viewers in the Boston area, about 7 percent of the game’s total U.S. audience.
The Super Bowl will not only be the top rated broadcast of the year in Boston, but it will be the highest-rated telecast in every city in the United States. What we won’t know is whether recent declines are the beginning of a larger trend or just simply a few off-years until much farther in the future.
For now though, the Super Bowl averages over 60 million more viewers than the second and third most-watched telecasts of the year: the AFC and NFC Championships. The NFL may be down for a variety of reasons, but as a whole, it by far and without question brings the largest American audience to TV screens.


